
Maltrail is a malicious traffic detection system, utilizing publicly available (black)lists containing malicious and/or generally suspicious trails, along with static trails compiled from various AV reports and custom user defined lists, where trail can be anything from domain name (e.g. zvpprsensinaix.com for Banjori malware), URL (e.g. hXXp://109.162.38.120/harsh02.exe for known malicious executable), IP address (e.g. 185.130.5.231 for known attacker) or HTTP User-Agent header value (e.g. sqlmap for automatic SQL injection and database takeover tool). Also, it uses (optional) advanced heuristic mechanisms that can help in discovery of unknown threats (e.g. new malware).
The following (black)lists (i.e. feeds) are being utilized:
360bigviktor, 360chinad, 360conficker, 360cryptolocker, 360gameover,
360locky, 360necurs, 360suppobox, 360tofsee, 360virut, abuseipdb, alienvault,
atmos, badips, bitcoinnodes, blackbook, blocklist, botscout,
bruteforceblocker, ciarmy, cobaltstrike, cruzit, cybercrimetracker,
dataplane, dshieldip, emergingthreatsbot, emergingthreatscip,
emergingthreatsdns, feodotrackerip, gpfcomics, greensnow, ipnoise,
kriskinteldns, kriskintelip, malc0de, malwaredomainlistdns, malwaredomains,
maxmind, minerchk, myip, openphish, palevotracker, policeman, pony,
proxylists, proxyrss, proxyspy, ransomwaretrackerdns, ransomwaretrackerip,
ransomwaretrackerurl, riproxies, rutgers, sblam, socksproxy, sslbl,
sslproxies, talosintelligence, torproject, trickbot, turris, urlhaus,
viriback, vxvault, zeustrackermonitor, zeustrackerurl, etc.
As of static entries, the trails for the following malicious entities (e.g. malware C&Cs or sinkholes) have been manually included (from various AV reports and personal research):
1ms0rry, 404, 9002, aboc, absent, ab, acbackdoor, acridrain, activeagent,
adrozek, advisorbot, adwind, adylkuzz, adzok, afrodita, agaadex, agenttesla,
aldibot, alina, allakore, almalocker, almashreq, alpha, alureon, amadey,
amavaldo, amend_miner, ammyyrat, android_acecard, android_actionspy,
android_adrd, android_ahmythrat, android_alienspy, android_andichap,
android_androrat, android_anubis, android_arspam, android_asacub,
android_backflash, android_bankbot, android_bankun, android_basbanke,
android_basebridge, android_besyria, android_blackrock, android_boxer,
android_buhsam, android_busygasper, android_calibar, android_callerspy,
android_camscanner, android_cerberus, android_chuli, android_circle,
android_claco, android_clickfraud, android_cometbot, android_cookiethief,
android_coolreaper, android_copycat, android_counterclank, android_cyberwurx,
android_darkshades, android_dendoroid, android_dougalek, android_droidjack,
android_droidkungfu, android_enesoluty, android_eventbot, android_ewalls,
android_ewind, android_exodus, android_exprespam, android_fakeapp,
android_fakebanco, android_fakedown, android_fakeinst, android_fakelog,
android_fakemart, android_fakemrat, android_fakeneflic, android_fakesecsuit,
android_fanta, android_feabme, android_flexispy, android_fobus,
android_fraudbot, android_friend, android_frogonal, android_funkybot,
android_gabas, android_geinimi, android_generic, android_geost,
android_ghostpush, android_ginmaster, android_ginp, android_gmaster,
android_gnews, android_godwon, android_golddream, android_goldencup,
android_golfspy, android_gonesixty, android_goontact, android_gplayed,
android_gustuff, android_gypte, android_henbox, android_hiddad,
android_hydra, android_ibanking, android_joker, android_jsmshider,
android_kbuster, android_kemoge, android_ligarat, android_lockdroid,
android_lotoor, android_lovetrap, android_malbus, android_mandrake,
android_maxit, android_mobok, android_mobstspy, android_monokle,
android_notcompatible, android_oneclickfraud, android_opfake,
android_ozotshielder, android_parcel, android_phonespy, android_pikspam,
android_pjapps, android_qdplugin, android_raddex, android_ransomware,
android_redalert, android_regon, android_remotecode, android_repane,
android_riltok, android_roamingmantis, android_roidsec, android_rotexy,
android_samsapo, android_sandrorat, android_selfmite, android_shadowvoice,
android_shopper, android_simbad, android_simplocker, android_skullkey,
android_sndapps, android_spynote, android_spytekcell, android_stels,
android_svpeng, android_swanalitics, android_teelog, android_telerat,
android_tetus, android_thiefbot, android_tonclank, android_torec,
android_triada, android_uracto, android_usbcleaver, android_viceleaker,
android_vmvol, android_walkinwat, android_windseeker, android_wirex,
android_wolfrat, android_xavirad, android_xbot007, android_xerxes,
android_xhelper, android_xploitspy, android_z3core, android_zertsecurity,
android_ztorg, andromeda, antefrigus, antibot, anubis, anuna, apocalypse,
apt_12, apt_17, apt_18, apt_23, apt_27, apt_30, apt_33, apt_37, apt_38,
apt_aridviper, apt_babar, apt_bahamut, etc.
Architecture
Maltrail is based on the Traffic -> Sensor <-> Server <-> Client architecture. Sensor(s) is a standalone component running on the monitoring node (e.g. Linux platform connected passively to the SPAN/mirroring port or transparently inline on a Linux bridge) or at the standalone machine (e.g. Honeypot) where it “monitors” the passing Traffic for blacklisted items/trails (i.e. domain names, URLs and/or IPs). In case of a positive match, it sends the event details to the (central) Server where they are being stored inside the appropriate logging directory (i.e. LOG_DIR described in the Configuration section). If Sensor is being run on the same machine as Server (default configuration), logs are stored directly into the local logging directory. Otherwise, they are being sent via UDP messages to the remote server (i.e. LOG_SERVER described in the Configuration section).

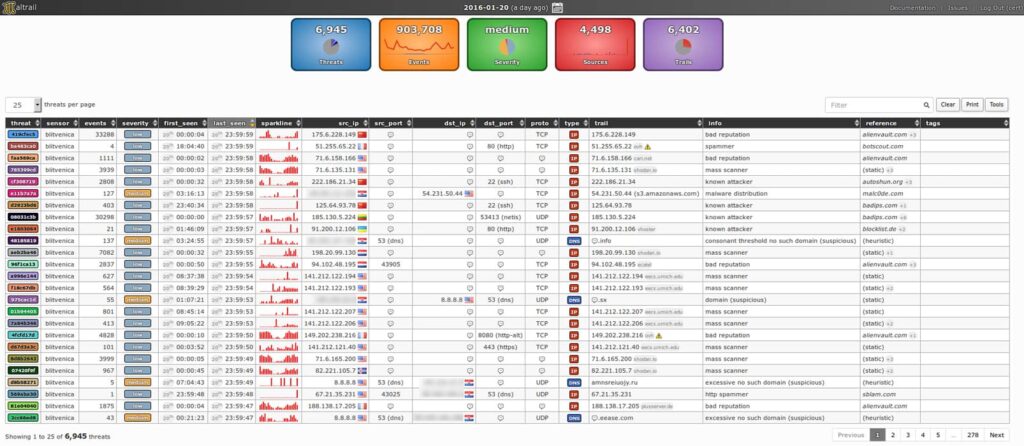
Server‘s primary role is to store the event details and provide back-end support for the reporting web application. In default configuration, server and sensor will run on the same machine. So, to prevent potential disruptions in sensor activities, the front-end reporting part is based on the “Fat client” architecture (i.e. all data post-processing is being done inside the client’s web browser instance). Events (i.e. log entries) for the chosen (24h) period are transferred to the Client, where the reporting web application is solely responsible for the presentation part. Data is sent toward the client in compressed chunks, where they are processed sequentially. The final report is created in a highly condensed form, practically allowing presentation of virtually unlimited number of events.
Note: Server component can be skipped altogether, and just use the standalone Sensor. In such case, all events would be stored in the local logging directory, while the log entries could be examined either manually or by some CSV reading application.
Demo pages
Fully functional demo pages with collected real-life threats can be found here:
Requirements
To properly run the Maltrail, Python 2.6, 2.7 or 3.x is required on *nix/BSD system, together with installed package pcapy-ng. Sensor component requires at least 1GB of RAM to run in single-process mode or more if run in multiprocessing mode, depending on the value used for option CAPTURE_BUFFER. Additionally, Sensor component (in general case) requires administrative/root privileges. Server component does not have any special requirements.
Quick start
The following set of commands should get your Maltrail Sensor up and running (out of the box with default settings and monitoring interface “any”):
- For Ubuntu/Debian
sudo apt-get install git python3 python3-dev python3-pip python-is-python3 libpcap-dev build-essential procps schedtool
sudo pip3 install pcapy-ng
git clone --depth 1 https://github.com/stamparm/maltrail.git
cd maltrail
sudo python3 sensor.py- For SUSE/openSUSE
sudo zypper install gcc gcc-c++ git libpcap-devel python-devel python2-pip procps schedtool
sudo pip2 install pcapy-ng
git clone --depth 1 https://github.com/stamparm/maltrail.git
cd maltrail
sudo python sensor.py- For Docker environment instructions can be found here.

To start the (optional) Server on same machine, open a new terminal and execute the following:
[[ -d maltrail ]] || git clone --depth 1 https://github.com/stamparm/maltrail.git
cd maltrail
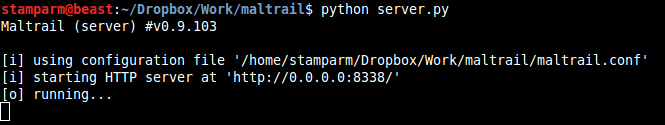
python server.py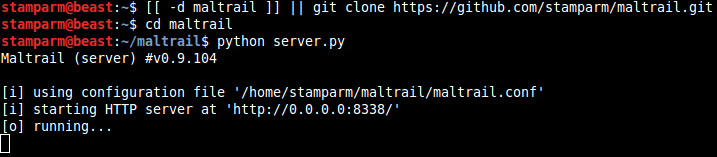
To test that everything is up and running execute the following:
ping -c 1 136.161.101.53
cat /var/log/maltrail/$(date +"%Y-%m-%d").log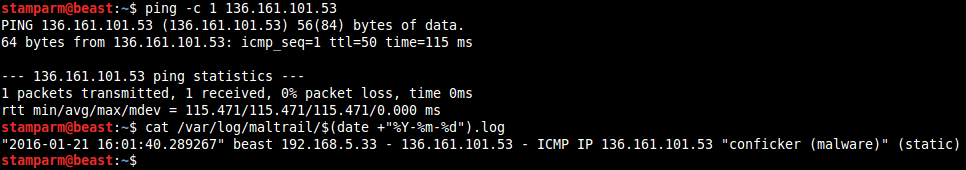
Also, to test the capturing of DNS traffic you can try the following:
nslookup morphed.ru
cat /var/log/maltrail/$(date +"%Y-%m-%d").log
To stop Sensor and Server instances (if running in background) execute the following:
sudo pkill -f sensor.py
pkill -f server.py
Access the reporting interface (i.e. Client) by visiting the http://127.0.0.1:8338 (default credentials: admin:changeme!) from your web browser:

Administrator’s guide
Sensor
Sensor’s configuration can be found inside the maltrail.conf file’s section [Sensor]:

If option USE_MULTIPROCESSING is set to true then all CPU cores will be used. One core will be used only for packet capture (with appropriate affinity, IO priority and nice level settings), while other cores will be used for packet processing. Otherwise, everything will be run on a single core. Option USE_FEED_UPDATES can be used to turn off the trail updates from feeds altogether (and just use the provided static ones). Option UPDATE_PERIOD contains the number of seconds between each automatic trails update (Note: default value is set to 86400 (i.e. one day)) by using definitions inside the trails directory (Note: both Sensor and Server take care of the trails update). Option CUSTOM_TRAILS_DIR can be used by user to provide location of directory containing the custom trails (*.txt) files.
Option USE_HEURISTICS turns on heuristic mechanisms (e.g. long domain name (suspicious), excessive no such domain name (suspicious), direct .exe download (suspicious), etc.), potentially introducing false positives. Option CAPTURE_BUFFER presents a total memory (in bytes of percentage of total physical memory) to be used in case of multiprocessing mode for storing packet capture in a ring buffer for further processing by non-capturing processes. Option MONITOR_INTERFACE should contain the name of the capturing interface. Use value any to capture from all interfaces (if OS supports this). Option CAPTURE_FILTER should contain the network capture (tcpdump) filter to skip the uninteresting packets and ease the capturing process. Option SENSOR_NAME contains the name that should be appearing inside the events sensor_name value, so the event from one sensor could be distinguished from the other. If option LOG_SERVER is set, then all events are being sent remotely to the Server, otherwise they are stored directly into the logging directory set with option LOG_DIR, which can be found inside the maltrail.conf file’s section [All]. In case that the option UPDATE_SERVER is set, then all the trails are being pulled from the given location, otherwise they are being updated from trails definitions located inside the installation itself.
Options SYSLOG_SERVER and/or LOGSTASH_SERVER can be used to send sensor events (i.e. log data) to non-Maltrail servers. In case of SYSLOG_SERVER, event data will be sent in CEF (Common Event Format) format to UDP (e.g. Syslog) service listening at the given address (e.g. 192.168.2.107:514), while in case of LOGSTASH_SERVER event data will be sent in JSON format to UDP (e.g. Logstash) service listening at the given address (e.g. 192.168.2.107:5000).
Example of event data being sent over UDP is as follows:
- For option
SYSLOG_SERVER(Note:LogSeverityvalues are 0 (for low), 1 (for medium) and 2 (for high)):
Dec 24 15:05:55 beast CEF:0|Maltrail|sensor|0.27.68|2020-12-24|andromeda (malware)|2|src=192.168.5.137 spt=60453 dst=8.8.8.8 dpt=53 trail=morphed.ru ref=(static)- For option
LOGSTASH_SERVER:
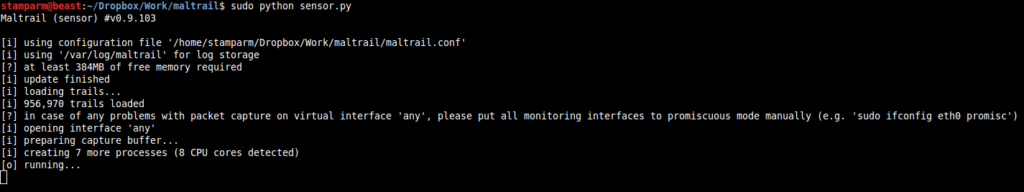
{"timestamp": 1608818692, "sensor": "beast", "severity": "high", "src_ip": "192.168.5.137", "src_port": 48949, "dst_ip": "8.8.8.8", "dst_port": 53, "proto": "UDP", "type": "DNS", "trail": "morphed.ru", "info": "andromeda (malware)", "reference": "(static)"}When running the sensor (e.g. sudo python sensor.py) for the first time and/or after a longer period of non-running, it will automatically update the trails from trail definitions (Note: stored inside the trails directory). After the initialization, it will start monitoring the configured interface (option MONITOR_INTERFACE inside the maltrail.conf) and write the events to either the configured log directory (option LOG_DIR inside the maltrail.conf file’s section [All]) or send them remotely to the logging/reporting Server (option LOG_SERVER).
Detected events are stored inside the Server‘s logging directory (i.e. option LOG_DIR inside the maltrail.conf file’s section [All]) in easy-to-read CSV format (Note: whitespace ‘ ‘ is used as a delimiter) as single line entries consisting of: timesensorsrc_ipsrc_portdst_ipdst_portprototrail_typetrailtrail_inforeference
e.g. "2015-10-19 15:48:41.152513" beast 192.168.5.33 32985 8.8.8.8 53 UDP DNS 0000mps.webpreview.dsl.net malicious siteinspector.comodo.com)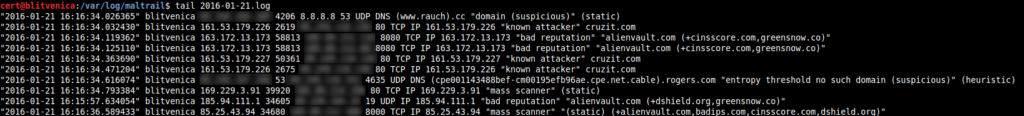
Server
Server’s configuration can be found inside the maltrail.conf section [Server]:

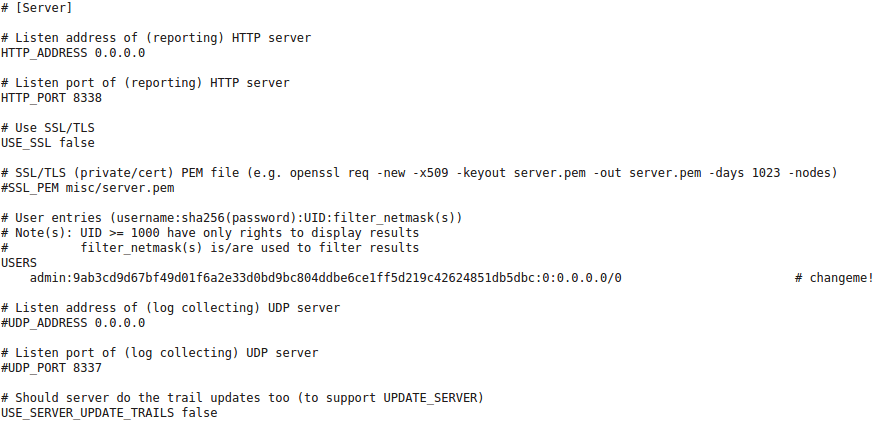
Option HTTP_ADDRESS contains the web server’s listening address (Note: use 0.0.0.0 to listen on all interfaces). Option HTTP_PORT contains the web server’s listening port. Default listening port is set to 8338. If option USE_SSL is set to true then SSL/TLS will be used for accessing the web server (e.g. https://192.168.6.10:8338/). In that case, option SSL_PEM should be pointing to the server’s private/cert PEM file.
Subsection USERS contains user’s configuration settings. Each user entry consists of the username:sha256(password):UID:filter_netmask(s). Value UID represents the unique user identifier, where it is recommended to use values lower than 1000 for administrative accounts, while higher value for non-administrative accounts. The part filter_netmask(s) represents the comma-delimited hard filter(s) that can be used to filter the shown events depending on the user account(s). Default entry is as follows:

Option UDP_ADDRESS contains the server’s log collecting listening address (Note: use 0.0.0.0 to listen on all interfaces), while option UDP_PORT contains listening port value. If turned on, when used in combination with option LOG_SERVER, it can be used for distinct (multiple) Sensor <-> Server architecture.
Option FAIL2BAN_REGEX contains the regular expression (e.g. attacker|reputation|potential[^”]*(web scan|directory traversal|injection|remote code)|spammer|mass scanner) to be used in /fail2ban web calls for extraction of today’s attacker source IPs. This allows the usage of IP blocking mechanisms (e.g. fail2ban, iptables or ipset) by periodic pulling of blacklisted IP addresses from remote location. Example usage would be the following script (e.g. run as a root cronjob on a minute basis):
#!/bin/bash
ipset -q flush maltrail
ipset -q create maltrail hash:net
for ip in $(curl http://127.0.0.1:8338/fail2ban 2>/dev/null | grep -P '^[0-9.]+$'); do ipset add maltrail $ip; done
iptables -I INPUT -m set --match-set maltrail src -j DROP
Same as for Sensor, when running the Server (e.g. python server.py) for the first time and/or after a longer period of non-running, if option USE_SERVER_UPDATE_TRAILS is set to true, it will automatically update the trails from trail definitions (Note: stored inside the trails directory). Its basic function is to store the log entries inside the logging directory (i.e. option LOG_DIR inside the maltrail.conf file’s section [All]) and provide the web reporting interface for presenting those same entries to the end-user (Note: there is no need install the 3rd party web server packages like Apache):
Install Maltrail
On Ubuntu/Debian
sudo apt-get install git python3 python3-dev python3-pip python-is-python3 libpcap-dev build-essential procps schedtool
sudo pip3 install pcapy-ng
cd /tmp
git clone --depth 1 https://github.com/stamparm/maltrail.git
sudo mv /tmp/maltrail /opt
sudo chown -R $USER:$USER /opt/maltrail
On SUSE/openSUSE
sudo zypper install gcc gcc-c++ git libpcap-devel python-devel python2-pip procps schedtool
sudo pip2 install pcapy-ng
cd /tmp
git clone --depth 1 https://github.com/stamparm/maltrail.git
sudo mv /tmp/maltrail /opt
sudo chown -R $USER:$USER /opt/maltrail
Set working environment:
sudo mkdir -p /var/log/maltrail
sudo mkdir -p /etc/maltrail
sudo cp /opt/maltrail/maltrail.conf /etc/maltrail
sudo nano /etc/maltrail/maltrail.conf
Set running environment:
crontab -e # autostart server & periodic update
*/5 * * * * if [ -n "$(ps -ef | grep -v grep | grep 'server.py')" ]; then : ; else python /opt/maltrail/server.py -c /etc/maltrail/maltrail.conf; fi
0 1 * * * cd /opt/maltrail && git pull
sudo crontab -e # autostart sensor & periodic restart
*/1 * * * * if [ -n "$(ps -ef | grep -v grep | grep 'sensor.py')" ]; then : ; else python /opt/maltrail/sensor.py -c /etc/maltrail/maltrail.conf; fi
2 1 * * * /usr/bin/pkill -f maltrail
maltrail (this link opens in a new window) by stamparm (this link opens in a new window)
Malicious traffic detection system